Climate Update, May 8th.
Lots of Super El Niño talk, but it is just talk!

Good morning all, a weather update today, or more specifically another climate update. Before that, I have decided I am going to extend the summer sale for the entire year of year 2026. This is by popular demand and some farmers thinking they missed out after March 28. This will apply to 12 month platinum subscriptions only, and use the SUMMER30 discount code and press apply when signing up.
A lot of talk out there about Super El Nino, I am sure all of you have seen the social media pages and clickbait going crazy. I don’t normally do this, but today I am going to show you why not everything is at seems, and what is real and what is not. And I am going to allow you to look at the key indicator that only the very best forecasters will use to determine what is real.
First off, the areas that are most affected by what is happening with the climate is Southern Australia, and the lack of cold fronts we are seeing due to the ridiculous increasing warmth of the oceans, which by the way is a natural occurring oscillation and linked to seismic activity. So one thing you cannot do, is believe that I am talking about a specific location, or your location, when I post on here, I am being very general.
The Gold standard years for El Nino are 1997 and 1982. The reason is because we had a strongly coupled atmosphere with the oceans.

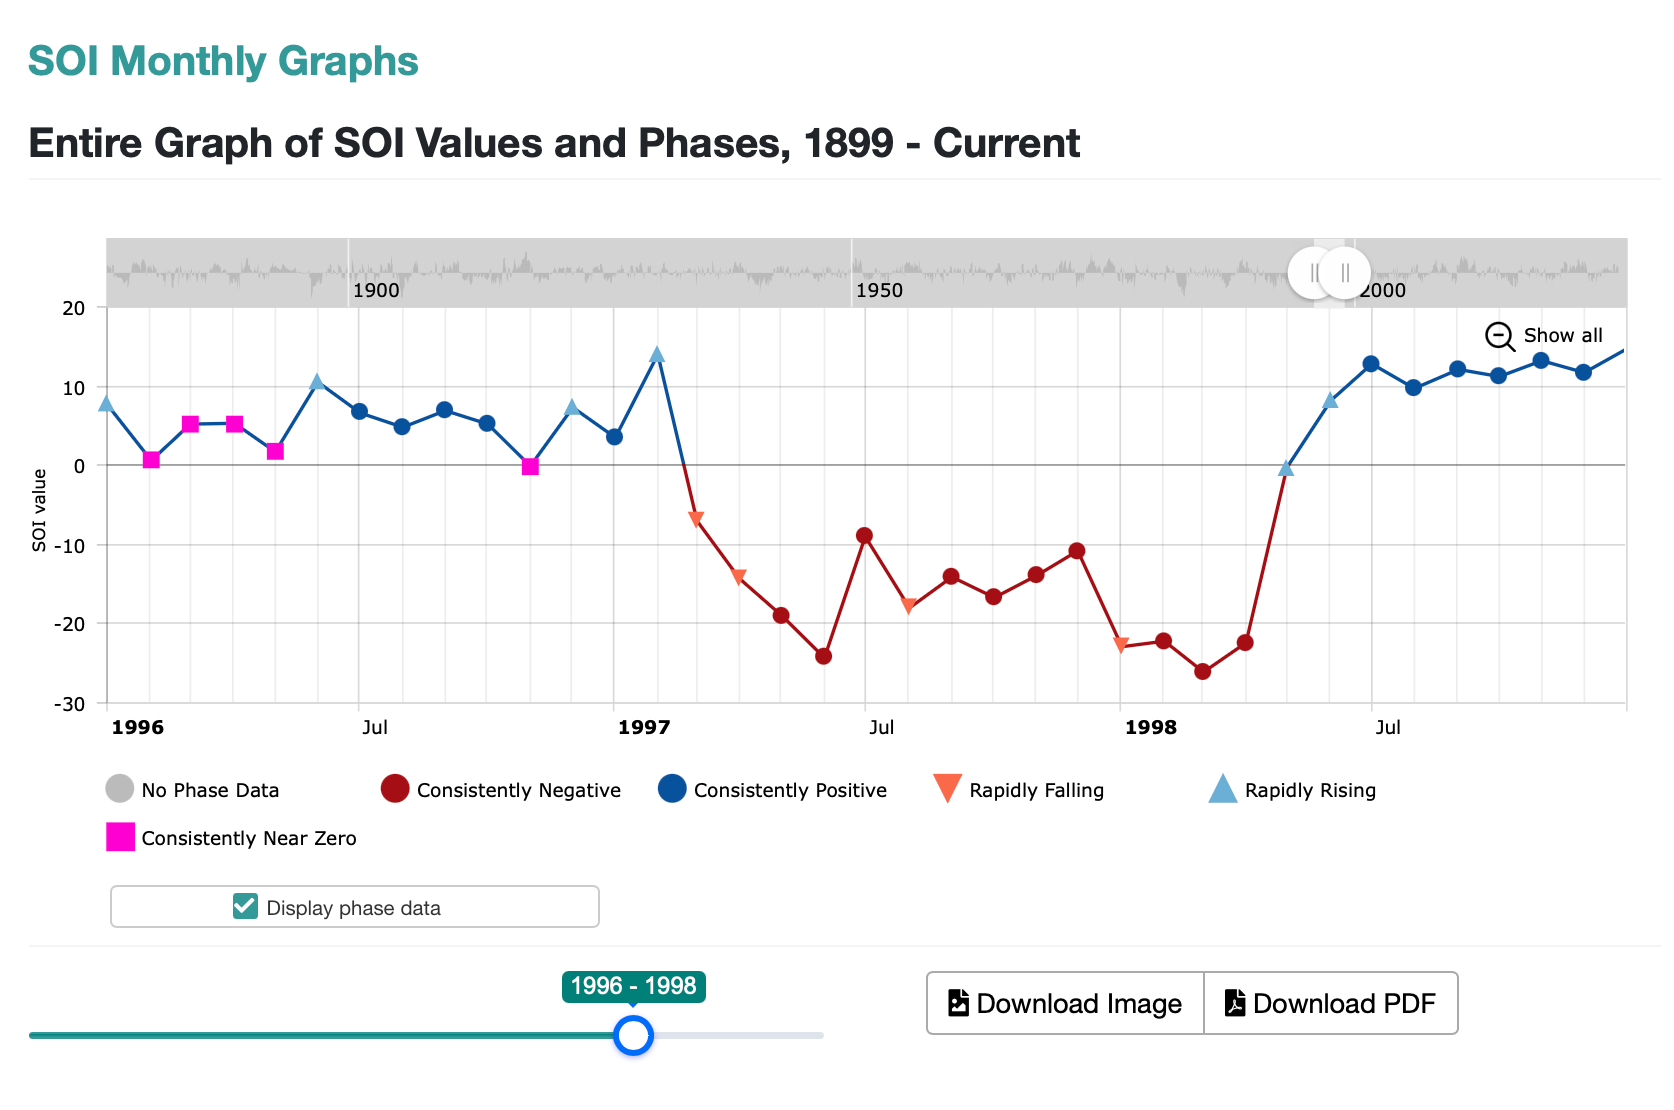
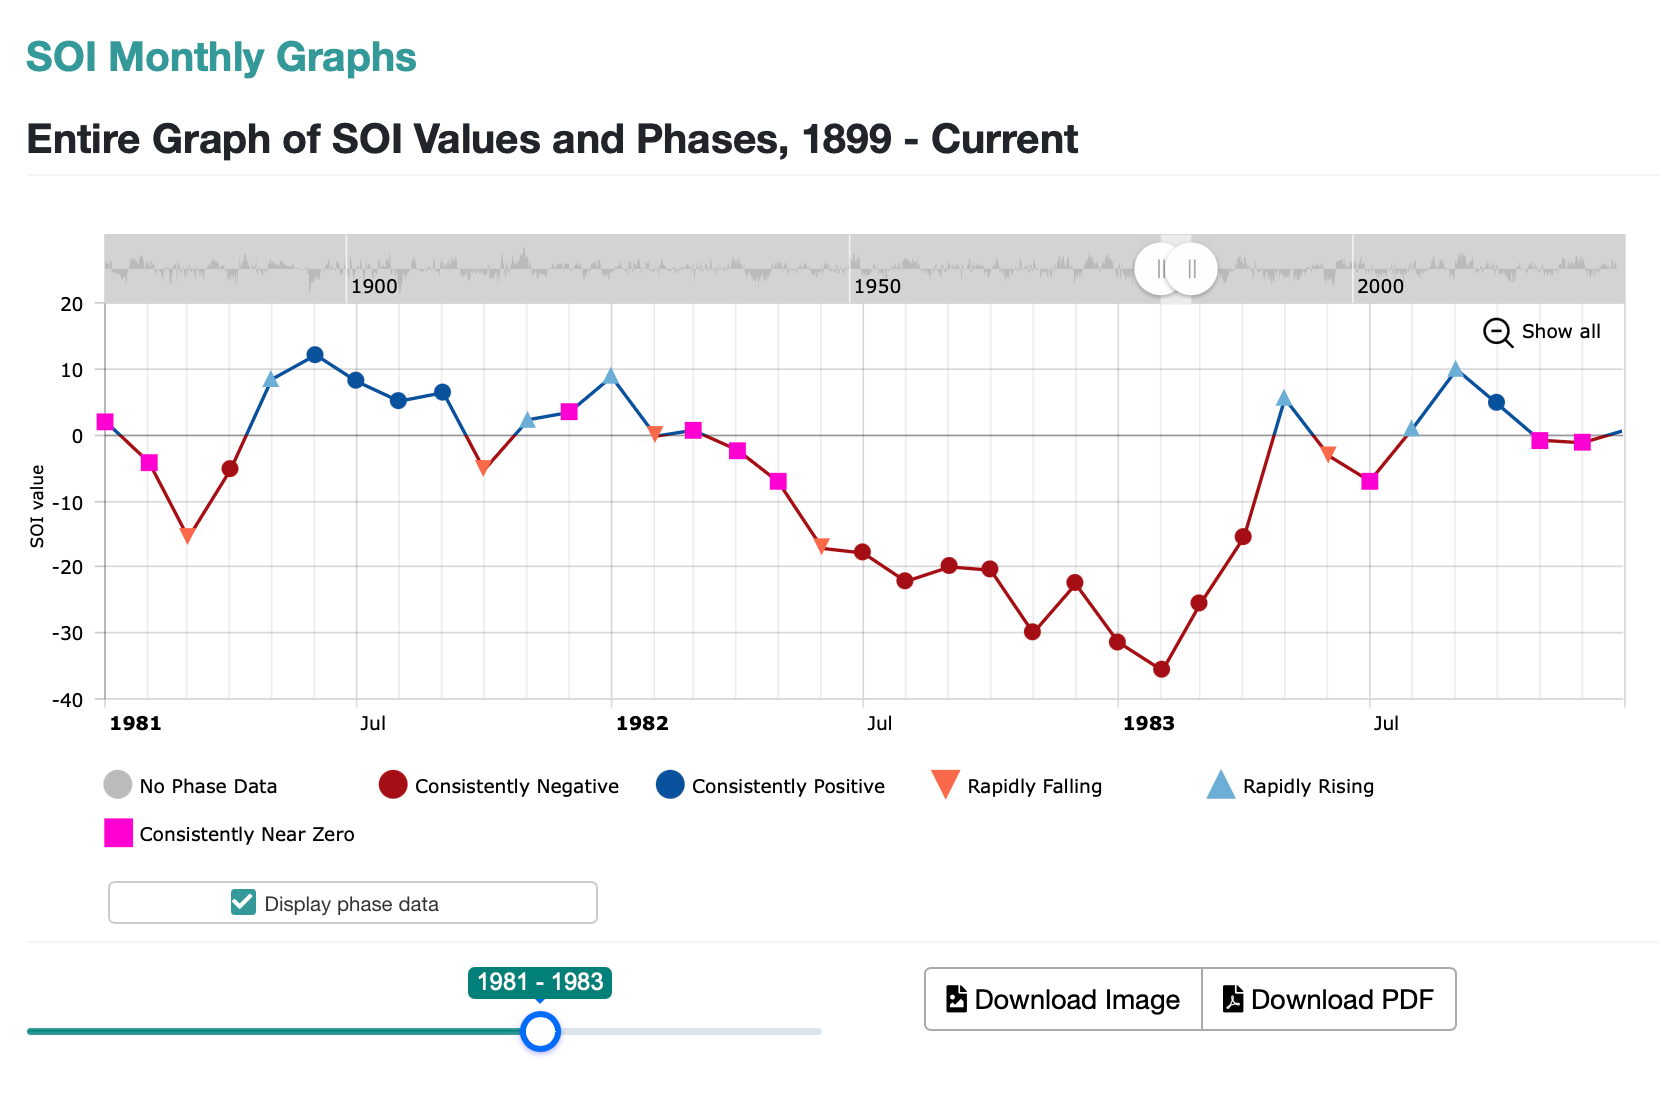
The first two slides above show the Southern Oscillation Index for both years, as you can see, almost 12 months below minus 10, and setting up in autumn. This year, we have seen out first negative month, but in June and July we are likely to head towards neutral again, which straight away rules out a strong coupling.
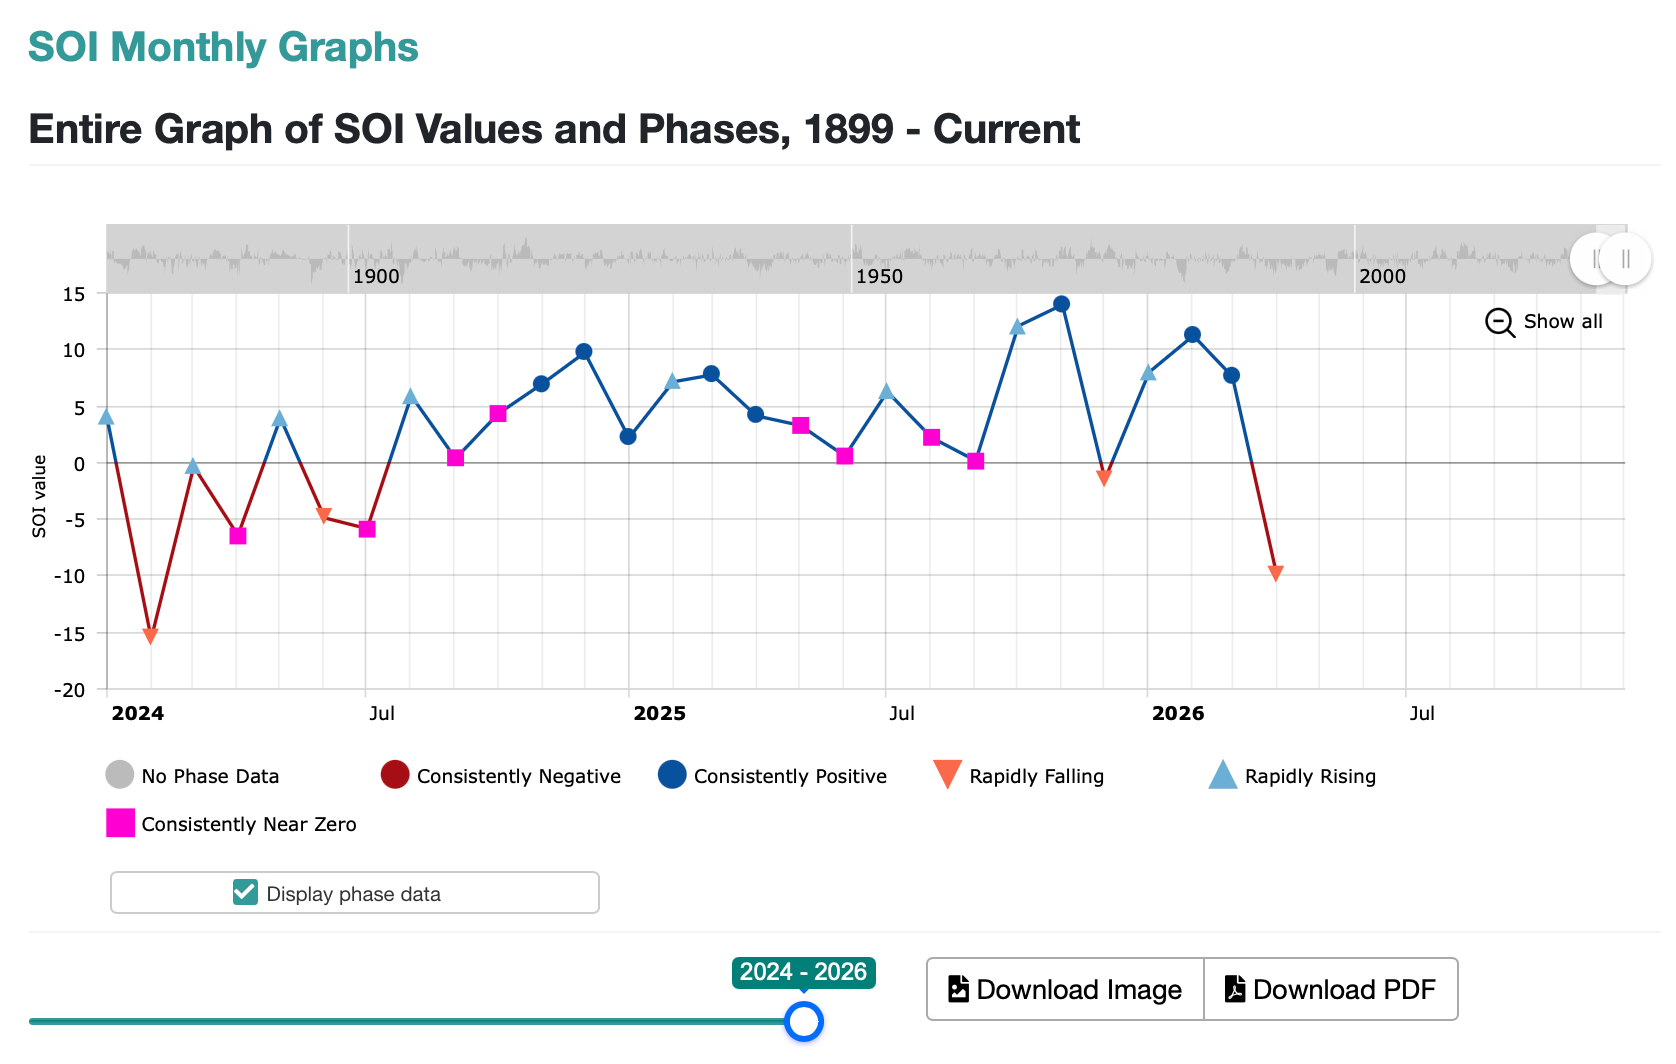
The third slide is where we are now, nowhere near it yet. So the best indicator to see where things are at is the Multivariate El Nino Index, or the MEI.
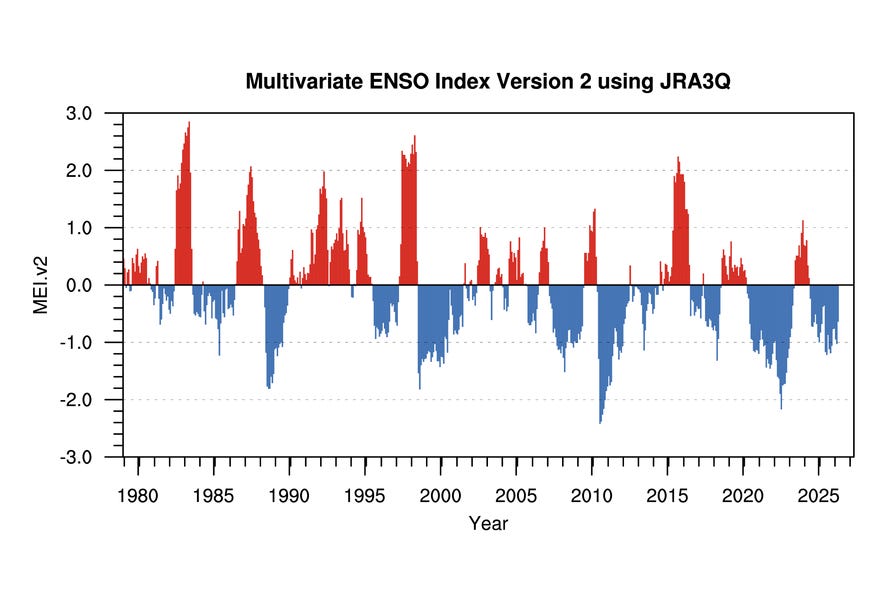
I have attached a graph form of the reading above, obviously the red spikes are when we have El Nino, and the blue indicates when we are in La Nina.
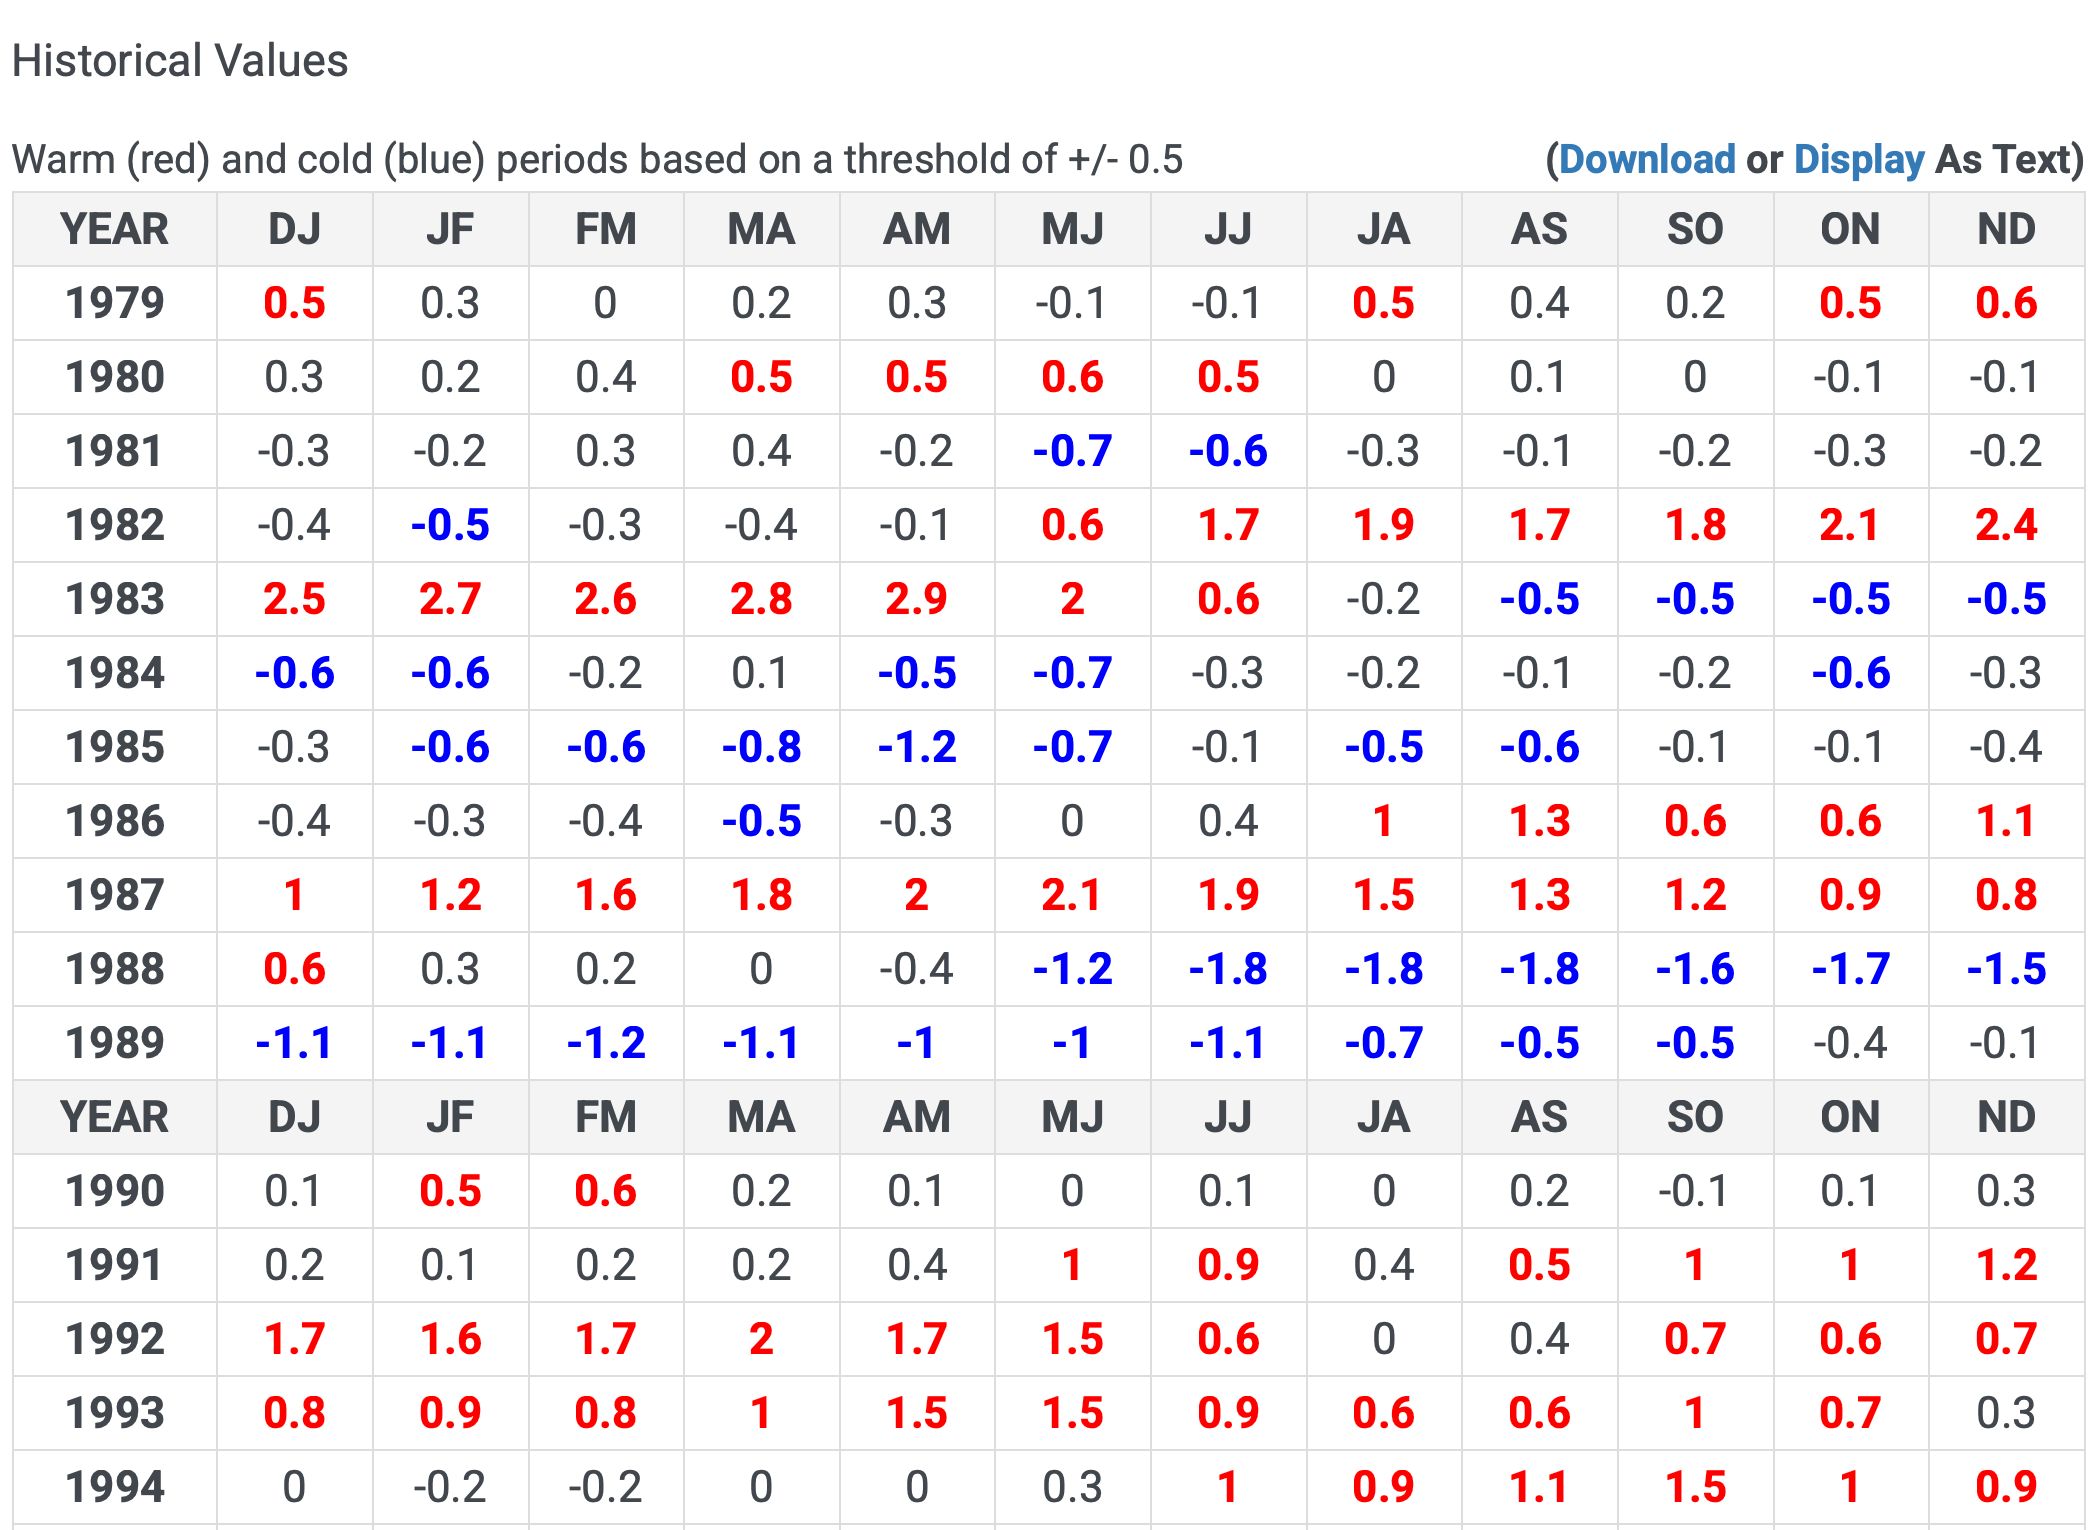
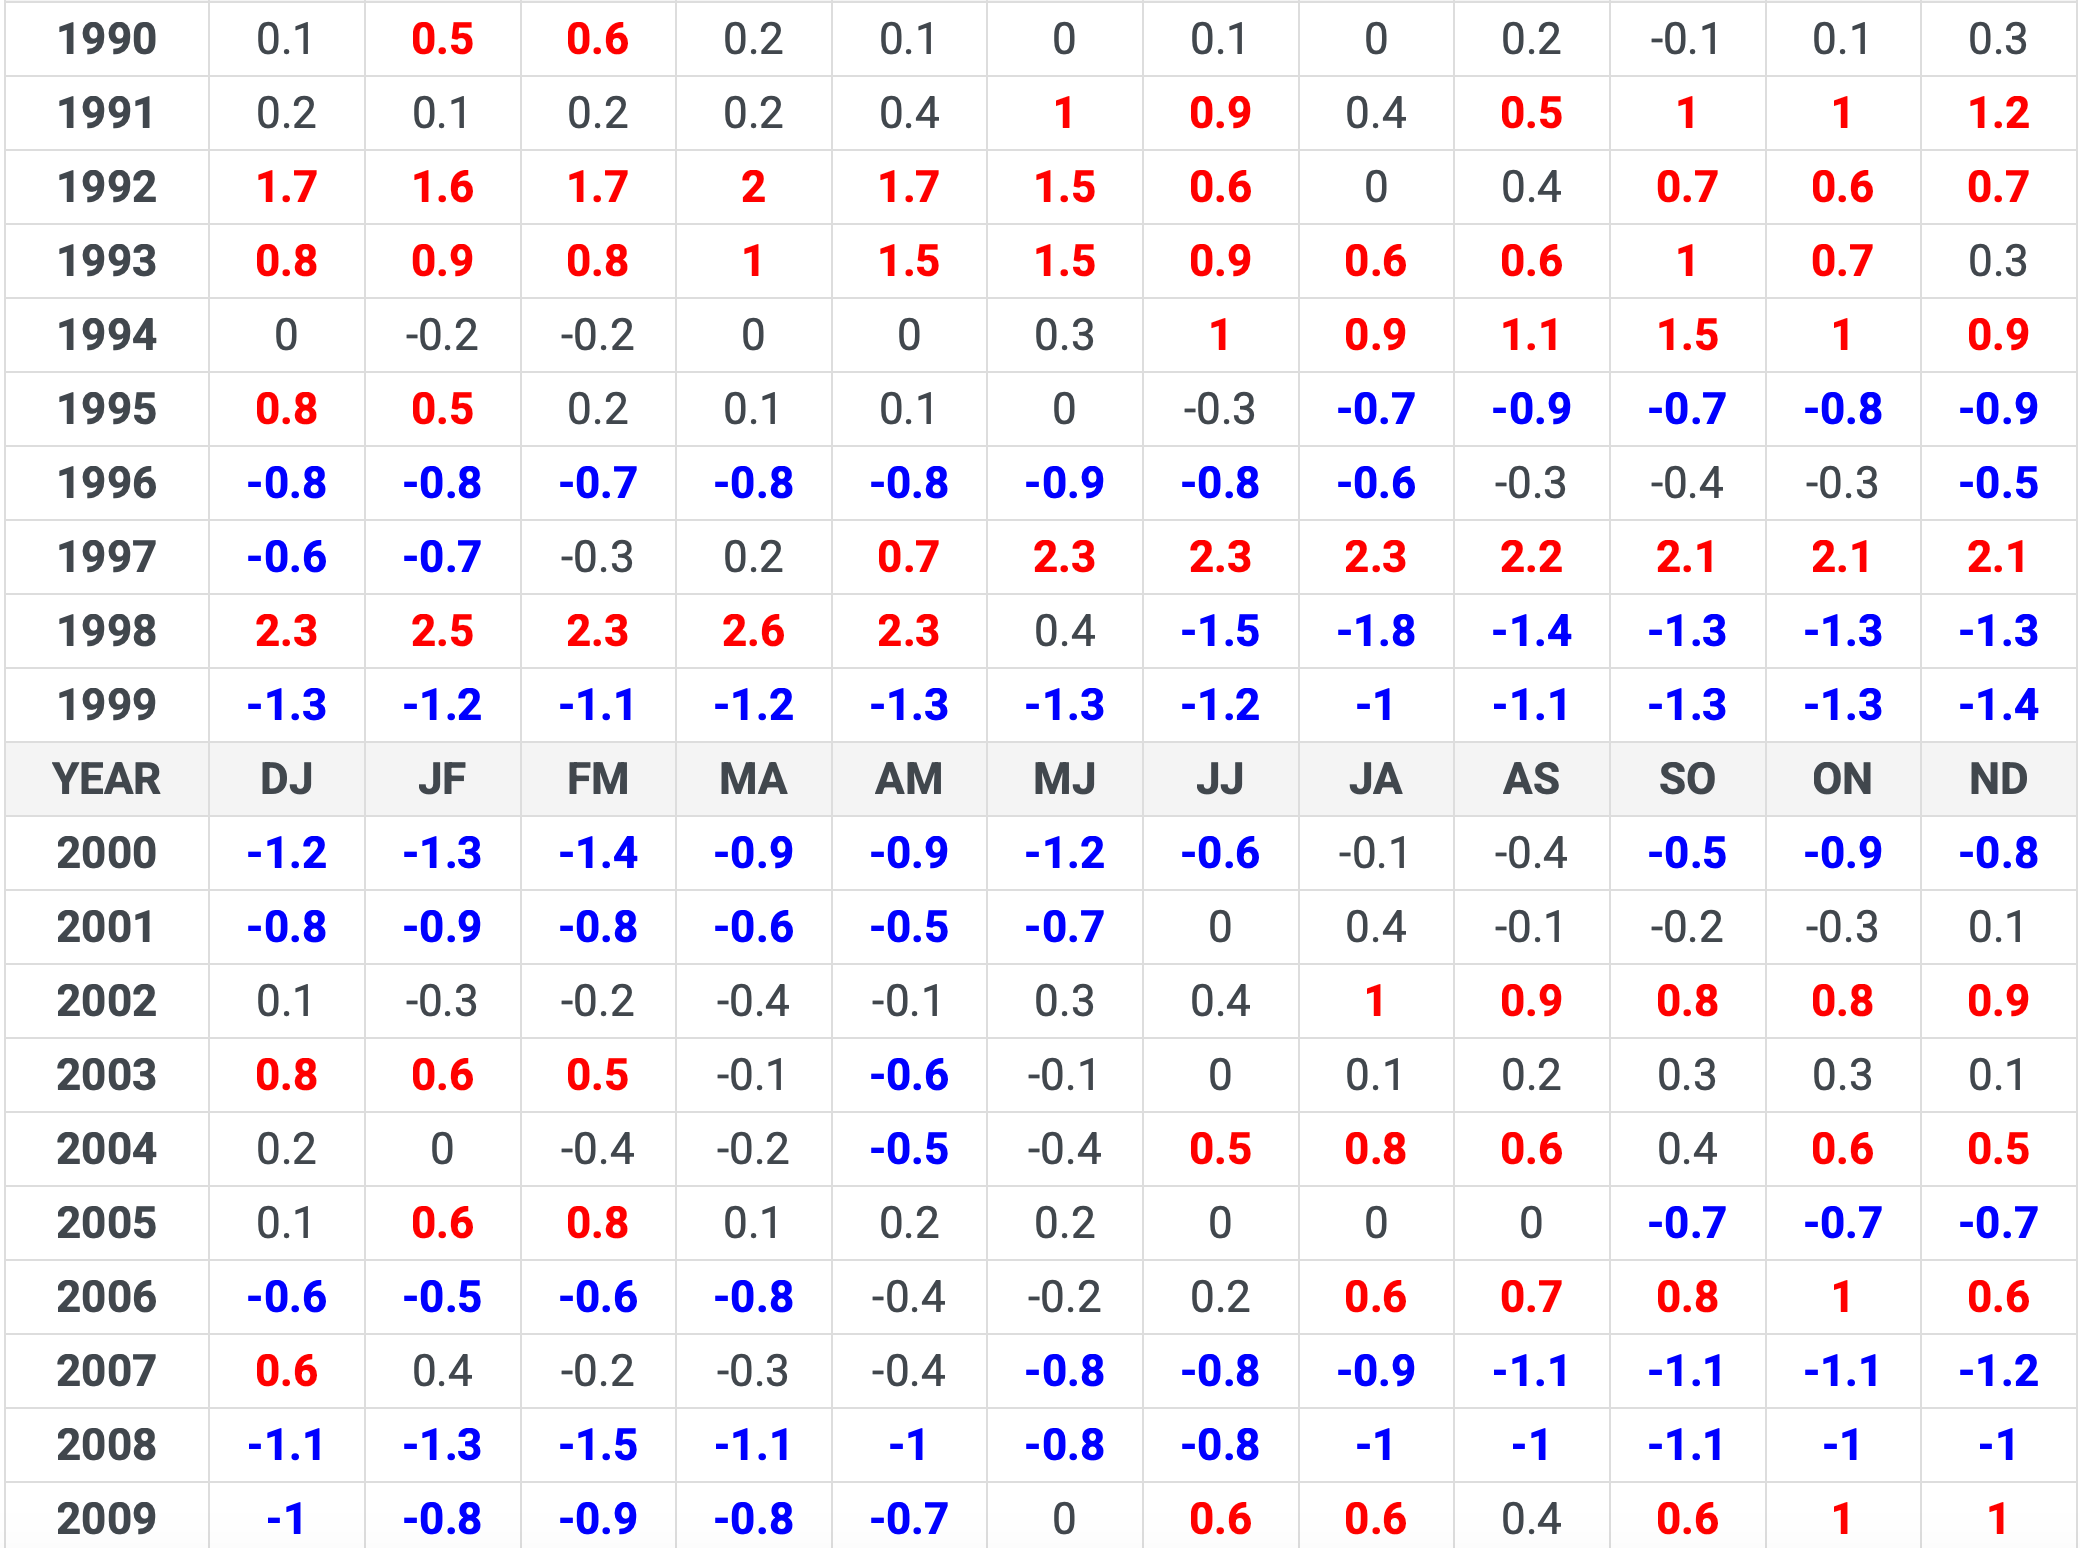
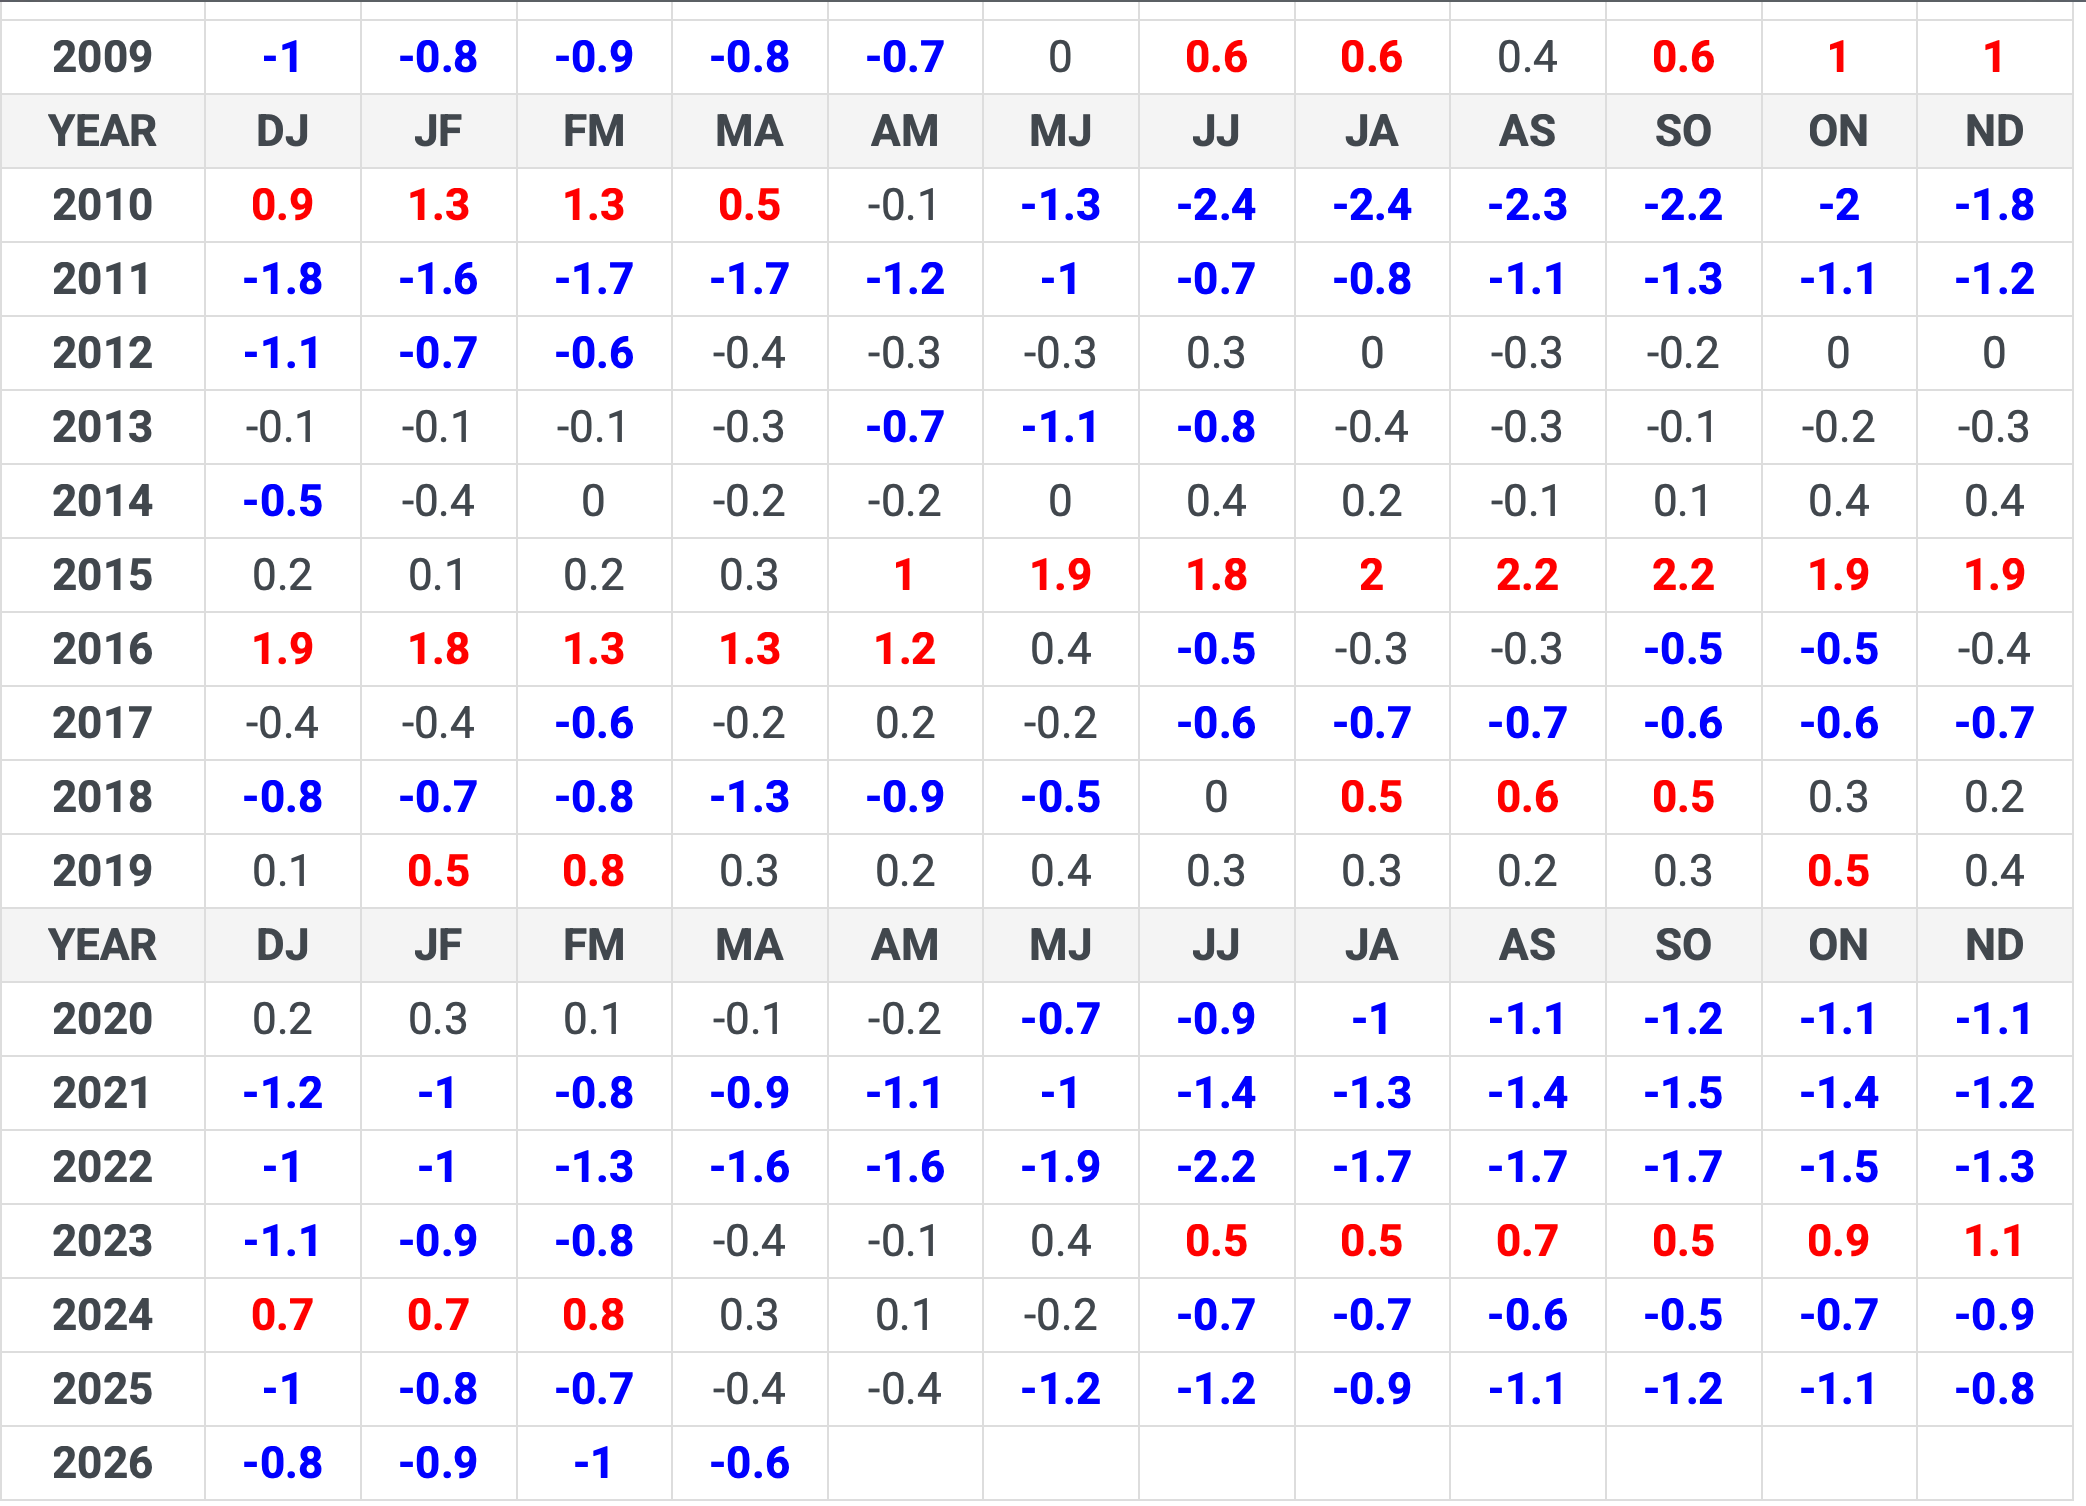
And then I have added the entire time series by the numbers to current day since 1979. You can clearly see where the big El Nino events are by the numbers, with 1982, 1997, 2015, they are the big ones, with 1982/83 the most severe drought of them all.
By monitoring this, you will get a very clear picture of where things are at regarding the climate, and the weather pattern locally. So my point is, not every month in a dry year is dry, and not every area is drier either. This year, there are specific areas that are going to be drier than normal, and other areas that will be wetter than normal. So, to get anywhere near close, you need to know where things are at, and we are currently at -0.6 on the MEI, and remaining a good chance of rainfall across the country in the shorter term.
As always, stay safe out there, and good luck to all.